Personal Communication Analytics as an Alternative Way to Predict Public Support, and Maybe Even Elections
When Nate Silver predicted Hillary Clinton had only a 71.4 percent chance of winning, he was roundly ridiculed. The New York Times began their election night coverage by predicting Clinton’s chances at around 80 percent, and the Huffington Post gave Hillary a 98.2 percent chance of becoming our 45th president.
But as election results rolled in Tuesday night, it became all too clear: public opinion polling and the election prediction modeling is flawed.
Pollsters Underestimated Trump’s Strength
Communication style is a huge variable in any situation, and particularly in political campaigns. The rally speeches, debates, and advertisements from the candidates have, arguably, the largest impact on audience reaction and behavior.
But the public opinion pollsters were so hyper focused on substance — and let’s face it, Clinton had substance in spades — that they failed to take style into account. And, as we’ve found, style is key.
So what do we do about it? We find better data. Rather than simply measuring public opinion polls, we have to factor in whether the way a potential leader communicates his or her message is likely to sway voters more than the message itself.
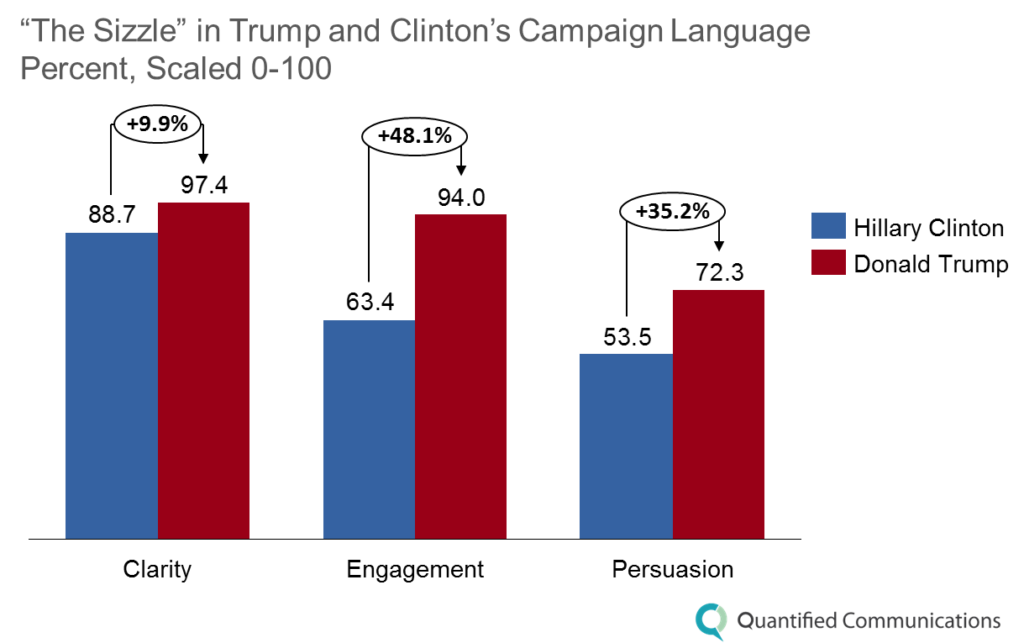
Our Analytics Told a Different Story
Linguistic analysis picks up something that polling-based model does not. When we looked at public opinion polls, we didn’t see the expectations and predictions reflected in our linguistic measures. Given the atypical nature of this election, we fell into the substance-over-style trap, as well. After all, Trump had no interest in being a traditional politician, so why would we measure him as one?
This is a new trend. We’re learning.
But the signals were there. Our data consistently showed a significant difference in the effectiveness of Donald Trump vs. Hillary Clinton.
We tracked both candidates throughout their campaign, analyzing 18 pieces of communication from Donald Trump, and 16 from Hillary Clinton, dating back to their campaign announcements in mid-2015 and including primary debates, victory speeches, convention remarks, and general election debates.
And, polling numbers and confirmation bias aside, our data clearly shows that Trump outperformed Clinton on 3 key measures for political communication.
- Clarity: Trump + 9.9% – While his logic wasn’t always traceable, Trump’s messages were clear. His simple vocabulary and repetitive style stuck with people, and his memorable descriptors and uncomplicated language made those messages stick.
- Engagement: Trump +48.1% – According to Mark McKinnon, chief strategy and media advisor to a former US president, and producer of the Showtime hit, “The Circus,” in today’s political landscape, we tend to favor the candidate who comes with the best narrative. Clinton was consistently derided as unengaging, lacking a unifying campaign narrative. Our data supports that, with Donald Trump using 30 percent more engaging language than his opponent to solidify his narrative in voters’ minds.
- Persuasion: Trump +35.2% – While Clinton leaned on logical appeals, Trump relied on a combination of appeals to emotions and instincts to persuade voters that he was the candidate to choose. To his credit, Trump demonstrated all along that he knew his audience and knew how he needed to address voters’ hearts in order to influence them.
There’s an old adage in the marketing world, made famous by Chili’s: you’ve got to use the sizzle to sell the steak.

While Clinton was airtight on the policies, facts, and experience, Trump stood out in terms of style, outperforming his opponent in Clarity, Engagement, and Persuasion. Clinton had plenty of steak to sell, but not enough sizzle; Trump, on the other hand, used all the sizzle he could muster to sell his platform.
Improving Our Predictive Models for Future Elections
Polling can be insightful (and it did predict the popular vote) but, as we’ve seen this week, it has its limitations. The way we cover for those limitations is by looking at the other side of the equation. Step back from what the audience is saying for a moment, and take a look at the messengers, themselves.
Linguistic analysis helps us do that, capturing the emotional connections the candidates are forging with their audiences — whether consciously or unconsciously — through the rhetoric of their campaigns.
Many will say this election broke all of the predictive models, but I’d argue it presented an opportunity to improve them. The polling-based model has its problems, and it can only take you so far. But when we factor in new sources of data, we can train that predictive model to be more and more accurate.
We have a component to add — personal communication analytics — through natural language processing and other advances in communication measurement technology, we can actually predict how an audience will react to any given speaker or message.
This is a new and innovative way to look at candidates and leadership, and it will only grow and become more sophisticated as we apply the learnings from this election to future analyses.
QC’s Takeaway: There Are Other Ways to Evaluate a Leader
We weren’t perfect about it. I personally didn’t want to believe what we were seeing. Our analytics said something different from what the pollsters were saying, and we got caught up in that intuition bias and joined the pollsters in herding our audience toward a singular view of the election. If everyone’s saying it, it must be right.
But the truth is, you can’t ask people what they intend to do, especially not when emotion is involved. And elections are highly emotional.
Our bias misled us in our analyses of the presidential debates, which were very close, with just a 6 percent difference between the candidates in many of our core political metrics. Like the pollsters, we assumed audiences would be attracted to substance over style and, in the metrics that explored that substance, our data did match the public intuition. And we confirmed our own bias during the national conventions, when Clinton clearly outperformed Trump in the core political metrics. But that event doesn’t represent the day-to-day campaigning.
Overall, Trump was consistently a more clear, engaging, and persuasive communicator. And his speaking style helped win him the White House.
Clinton has shortcomings as a communicator. She might connect well one-on-one and with donors but, in the end, she was not able to connect with the voting public in a compelling way.
The democratic candidate’s shortcomings were not in her messaging, experience, fundraising, or qualifications. She simply didn’t have the sizzle — she could’ve been more engaging and authentic, and she wasn’t as clear or as emotionally persuasive as her opponent. Her communication style wasn’t what voters were looking for in their next leader.
Next time, we’ll factor this into our expectations. Next election, personal analytics need to be part of the equation. And with some luck and continued effort, they’ll improve the way we gauge public support and the likely success of candidates.
To find out how QC can use our communication analytics platform to help your leadership deliver best-in-class messaging, email us at info@quantifiedcommunications.com.
![]()
![]()
![]()